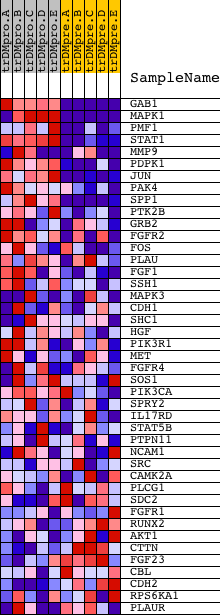
Profile of the Running ES Score & Positions of GeneSet Members on the Rank Ordered List
| Dataset | Set_04_transDMproB_versus_transDMpreB.phenotype_transDMproB_versus_transDMpreB.cls #transDMproB_versus_transDMpreB.phenotype_transDMproB_versus_transDMpreB.cls #transDMproB_versus_transDMpreB_repos |
| Phenotype | phenotype_transDMproB_versus_transDMpreB.cls#transDMproB_versus_transDMpreB_repos |
| Upregulated in class | transDMproB |
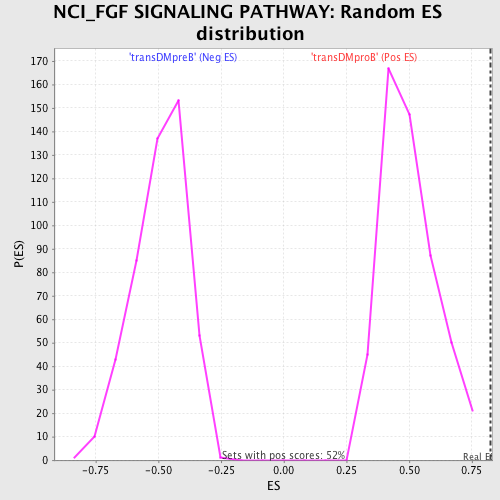
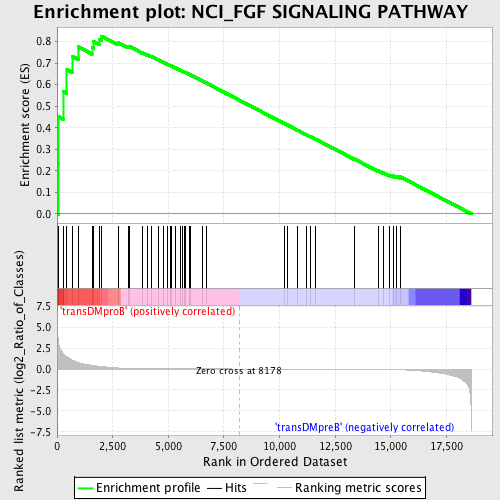
| GeneSet | NCI_FGF SIGNALING PATHWAY |
| Enrichment Score (ES) | 0.8257192 |
| Normalized Enrichment Score (NES) | 1.652299 |
| Nominal p-value | 0.0 |
| FDR q-value | 0.04328937 |
| FWER p-Value | 0.077 |
| PROBE | DESCRIPTION (from dataset) | GENE SYMBOL | GENE_TITLE | RANK IN GENE LIST | RANK METRIC SCORE | RUNNING ES | CORE ENRICHMENT | |
|---|---|---|---|---|---|---|---|---|
| 1 | GAB1 | 18828 | 58 | 3.226 | 0.2358 | Yes | ||
| 2 | MAPK1 | 1642 11167 | 80 | 2.911 | 0.4503 | Yes | ||
| 3 | PMF1 | 12452 | 296 | 1.747 | 0.5680 | Yes | ||
| 4 | STAT1 | 3936 5524 | 443 | 1.477 | 0.6695 | Yes | ||
| 5 | MMP9 | 14732 | 696 | 1.021 | 0.7316 | Yes | ||
| 6 | PDPK1 | 23097 | 950 | 0.777 | 0.7755 | Yes | ||
| 7 | JUN | 15832 | 1569 | 0.428 | 0.7739 | Yes | ||
| 8 | PAK4 | 17909 | 1643 | 0.400 | 0.7997 | Yes | ||
| 9 | SPP1 | 5501 | 1889 | 0.315 | 0.8098 | Yes | ||
| 10 | PTK2B | 21776 | 1990 | 0.287 | 0.8257 | Yes | ||
| 11 | GRB2 | 20149 | 2736 | 0.123 | 0.7947 | No | ||
| 12 | FGFR2 | 1917 4722 1119 | 3186 | 0.073 | 0.7760 | No | ||
| 13 | FOS | 21202 | 3267 | 0.066 | 0.7765 | No | ||
| 14 | PLAU | 22084 | 3853 | 0.034 | 0.7476 | No | ||
| 15 | FGF1 | 1994 23447 | 4054 | 0.027 | 0.7388 | No | ||
| 16 | SSH1 | 10540 | 4222 | 0.023 | 0.7315 | No | ||
| 17 | MAPK3 | 6458 11170 | 4552 | 0.016 | 0.7150 | No | ||
| 18 | CDH1 | 18479 | 4770 | 0.014 | 0.7043 | No | ||
| 19 | SHC1 | 9813 9812 5430 | 4950 | 0.012 | 0.6956 | No | ||
| 20 | HGF | 16916 | 5075 | 0.011 | 0.6897 | No | ||
| 21 | PIK3R1 | 3170 | 5127 | 0.011 | 0.6878 | No | ||
| 22 | MET | 17520 | 5337 | 0.010 | 0.6773 | No | ||
| 23 | FGFR4 | 3226 | 5546 | 0.008 | 0.6667 | No | ||
| 24 | SOS1 | 5476 | 5657 | 0.008 | 0.6613 | No | ||
| 25 | PIK3CA | 9562 | 5742 | 0.007 | 0.6573 | No | ||
| 26 | SPRY2 | 21725 | 5759 | 0.007 | 0.6570 | No | ||
| 27 | IL17RD | 22069 | 5936 | 0.007 | 0.6480 | No | ||
| 28 | STAT5B | 20222 | 5994 | 0.006 | 0.6454 | No | ||
| 29 | PTPN11 | 5326 16391 9660 | 6520 | 0.004 | 0.6175 | No | ||
| 30 | NCAM1 | 5149 | 6694 | 0.004 | 0.6085 | No | ||
| 31 | SRC | 5507 | 10223 | -0.005 | 0.4189 | No | ||
| 32 | CAMK2A | 2024 23541 1980 | 10341 | -0.005 | 0.4130 | No | ||
| 33 | PLCG1 | 14753 | 10822 | -0.007 | 0.3876 | No | ||
| 34 | SDC2 | 9134 | 11210 | -0.008 | 0.3673 | No | ||
| 35 | FGFR1 | 3789 8968 | 11379 | -0.008 | 0.3589 | No | ||
| 36 | RUNX2 | 4480 8700 | 11607 | -0.009 | 0.3474 | No | ||
| 37 | AKT1 | 8568 | 13355 | -0.021 | 0.2549 | No | ||
| 38 | CTTN | 8817 4575 1035 8818 | 14438 | -0.040 | 0.1996 | No | ||
| 39 | FGF23 | 17275 | 14683 | -0.047 | 0.1900 | No | ||
| 40 | CBL | 19154 | 14950 | -0.058 | 0.1799 | No | ||
| 41 | CDH2 | 1963 8727 8726 4508 | 15118 | -0.068 | 0.1760 | No | ||
| 42 | RPS6KA1 | 15725 | 15263 | -0.077 | 0.1739 | No | ||
| 43 | PLAUR | 18351 | 15433 | -0.089 | 0.1714 | No |